Key Takeaways
- Effective SEO reports focus on business outcomes (traffic, conversions, revenue) rather than vanity metrics like raw keyword counts.
- Structure reports with an executive summary, key metrics dashboard, detailed analysis, and actionable next steps for each reporting period.
- Automate data collection using Google Search Console API, GA4, and Rank Crown to reduce manual reporting time by 70-80%.
- Match reporting frequency to stakeholder needs: weekly for active campaigns, monthly for ongoing SEO, quarterly for executive reviews.
Why SEO Reporting Matters
SEO reporting transforms raw search data into actionable business intelligence. Without structured reporting, SEO teams cannot demonstrate ROI, identify declining performance before it becomes critical, or justify continued investment to stakeholders. Reports bridge the gap between technical SEO work and business decision-making. For background context, see the reference at Google Search Central documentation.
The most common reporting mistake is data dumping - exporting spreadsheets of keywords and traffic numbers without context or narrative. Effective reports tell a story: what happened, why it happened, what it means for the business, and what actions should follow. Each metric should connect to a business objective.
Use Rank Crown alongside Google Search Console and GA4 to build a comprehensive reporting stack. Rank Crown provides competitive context (how your rankings compare to competitors), while GSC shows impression and click data, and GA4 tracks on-site behavior and conversions from organic traffic.
Pro Tip: Create a one-page executive summary that non-technical stakeholders can understand in under 2 minutes. Save detailed analysis for appendix sections that SEO team members can review.

Key Metrics to Track
The essential SEO metrics to track fall into four categories: visibility (impressions, average position, keyword rankings), traffic (organic sessions, new users, landing page performance), engagement (bounce rate, time on page, pages per session), and conversions (goal completions, revenue, cost per acquisition).
Track leading indicators alongside lagging indicators. Leading indicators like indexation rates, crawl errors, and new backlinks predict future performance. Lagging indicators like organic traffic and conversions confirm past efforts are working. Monitoring both gives you early warning systems and proof of results.
- Organic traffic trend: month-over-month and year-over-year growth percentages from GA4
- Keyword ranking distribution: number of keywords in positions 1-3, 4-10, 11-20, and 20+ tracked via Rank Crown
- Click-through rate (CTR): average CTR from Google Search Console, segmented by branded vs. non-branded queries
- Conversion rate from organic: percentage of organic visitors completing target actions, tracked in GA4
- Backlink growth: new referring domains acquired monthly, monitored through Ahrefs or Rank Crown
Report Structure
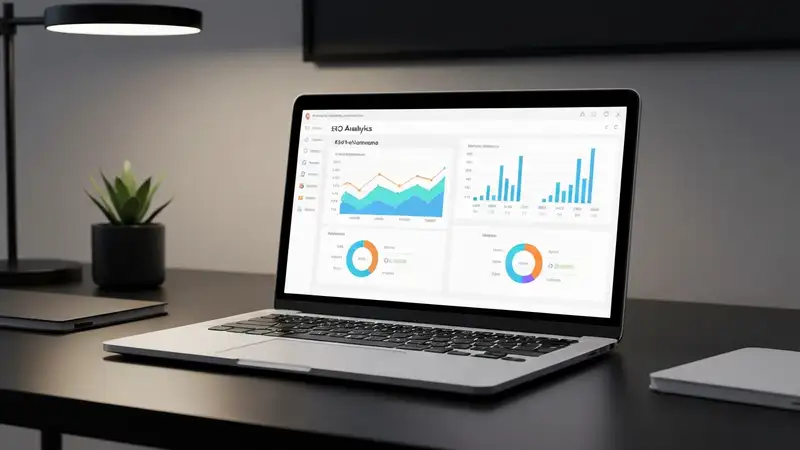
Structure every SEO report with these core sections: Executive Summary (2-3 bullet points of key wins and concerns), KPI Dashboard (visual overview of primary metrics), Detailed Analysis (deep dive into traffic, rankings, content, and technical health), Competitive Landscape (how you compare to key competitors), and Action Items (specific next steps with owners and deadlines).
Keep the executive summary under 200 words and lead with the most impactful finding. If organic revenue grew 15% month-over-month, that headline goes first. If a technical issue caused a 20% traffic drop, flag that immediately with a remediation plan. Stakeholders read the summary - make it count.
Include comparative context in every metric. Raw numbers like "12,500 organic sessions" mean nothing without context. Show month-over-month change (+8%), year-over-year change (+45%), and progress toward targets (83% of Q2 goal). Rank Crown dashboards can automate these comparisons across your keyword portfolio.
Pro Tip: Use consistent color coding across all reports: green for positive trends, red for negative, yellow for areas needing attention. This visual shorthand helps stakeholders scan reports quickly.

Tools & Dashboards
Build your reporting stack with complementary tools: Google Search Console (free, essential for impression/click data), GA4 (free, on-site behavior and conversions), Rank Crown (keyword tracking and competitive analysis), and Looker Studio or Google Sheets for custom dashboard creation.
Automate data collection wherever possible. Connect GSC and GA4 to Looker Studio for real-time dashboards. Use Rank Crown's API or export features to pull ranking data into your reporting workflow. Manual data collection is the biggest time sink in SEO reporting and the easiest to eliminate.
For client-facing reports, invest in branded templates with your agency logo, consistent formatting, and professional visualizations. Tools like Looker Studio, Rank Crown's built-in reports, and even well-designed Google Slides presentations create a polished impression that reinforces your expertise.
Data Visualization
Choose visualization types based on the story each metric tells. Use line charts for trends over time (traffic growth, ranking progress), bar charts for comparisons (page performance, keyword distribution), pie charts sparingly for proportional breakdowns (traffic sources), and tables for detailed keyword-level data.
Avoid chart junk - unnecessary gridlines, 3D effects, or dual axes that confuse rather than clarify. The best SEO visualizations convey one clear insight per chart. If a stakeholder needs more than 5 seconds to understand a chart, simplify it.
- Traffic trends: line chart showing organic sessions over 6-12 months with year-over-year comparison overlay
- Ranking distribution: stacked bar chart showing keywords in position buckets (1-3, 4-10, 11-20, 21+) over time
- Top performing pages: horizontal bar chart of top 10 landing pages by organic traffic or conversions
- Competitive gap: grouped bar chart comparing your domain metrics against 3-4 key competitors via Rank Crown
Pro Tip: Add annotations to trend charts marking major events like algorithm updates, site launches, or content campaigns. This context helps explain traffic fluctuations and demonstrates your awareness of external factors.
Reporting Frequency
Weekly reports work best for active campaigns, new site launches, or recovery from penalties. Keep weekly reports brief - a 5-minute summary of ranking changes, traffic anomalies, and task completion status. Use Rank Crown's automated alerts to flag significant ranking movements without manual monitoring.
Monthly reports are the standard for ongoing SEO engagements. They provide enough data to identify meaningful trends while avoiding the noise of daily fluctuations. Include a full performance review, content performance analysis, technical health check, and next month's action plan.
Quarterly reports serve executive audiences and strategic planning. Summarize three months of progress, calculate ROI, assess competitive positioning shifts, and propose strategy adjustments for the next quarter. These reports should explicitly connect SEO metrics to business revenue and growth objectives.
Frequently Asked Questions
What metrics should I include in an SEO report?
Every SEO report should include organic traffic (sessions and users), keyword rankings (distribution across position buckets), conversions from organic search, and backlink growth. Add technical health metrics like crawl errors and Core Web Vitals scores for comprehensive reporting. Rank Crown can automate ranking data collection across your entire keyword portfolio.
How often should I send SEO reports to clients?
Monthly reports are the industry standard for ongoing SEO campaigns. Send weekly snapshot reports during site migrations, penalty recovery, or the first 90 days of a new engagement. Quarterly strategic reviews work best for executive stakeholders who need big-picture ROI summaries rather than tactical details.
What tools are best for SEO reporting?
Combine Google Search Console (free impression and click data), GA4 (traffic and conversions), Rank Crown (keyword tracking and competitive analysis), and Looker Studio (custom dashboards) for a comprehensive reporting stack. This combination covers visibility, traffic, rankings, and business impact without expensive enterprise tools.
How do I make SEO reports understandable for non-technical stakeholders?
Lead with business outcomes (revenue, leads, conversions) rather than technical metrics. Use visual dashboards with trend lines and comparisons. Include a plain-language executive summary explaining what happened, why it matters, and what you plan to do next. Avoid jargon like crawl budget, canonicalization, or SERP features without brief explanations.
Related Resources
SEO Tool Comparison at a Glance
Choosing the right toolkit depends on your budget and the part of SEO you optimize most often. The table below summarizes how Rank Crown compares to the main alternatives covered across our resources.
| Tool | Starting Price | Free Plan | Best For |
|---|---|---|---|
| Rank Crown | $39/mo | Yes | Focused rank tracking + audits without bloat |
| Ahrefs | $129/mo | Limited | Backlink intelligence and large databases |
| Semrush | $139.95/mo | Limited | All-in-one for agencies combining SEO and PPC |
| Moz Pro | $99/mo | Limited | Beginner-friendly metrics like Domain Authority |
| SE Ranking | $65/mo | No | Budget-friendly tracking with white-label reports |
| Mangools | $29.90/mo | No | Lean keyword research workflow |
Prices verified 2026-05-20 from each vendor's public pricing page. Annual billing typically discounts these figures further.
Ready to Improve Your SEO?
Try Rank Crown's SEO tools to analyze, track, and optimize your website's search performance.
Start Free Trial